

Label-free Quantification
Cases
Technical Information
Contact Us / Wish List
 Label-free quantification is a method in mass spectrometry that aims to determine the relative amount of proteins in two or more biological samples. Unlike other methods for protein quantification, label-free quantification does not use a stable isotope containing compound to chemically bind to and label the protein.
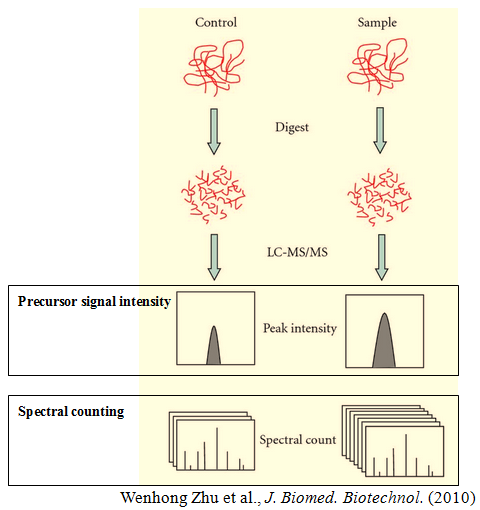
Label-free quantification is based on precursor signal intensity or spectral counting. The former is in most cases applied to data acquired on high mass precision spectrometers equipped with the new generation of mass analyzers. The high-resolution power facilitates the extraction of peptide signals on the MS1 level and thus uncouples the quantification from the identification process. The latter simply counts the number of spectra identified for a given peptide in different biological samples and then integrates the results for all measured peptides of the protein(s) that are quantified.
Benefits:
- Widely applied to complex biomarker discovery and systems biology studies, as well as to research on isolated proteins and protein complexes.
- An unlimited number of samples can be compared, allowing us to measure large changes in protein expression.
- Simple and rapid sample preparation. We accept samples from any origin.
Comparative Analysis of Dynamic Proteomic Profiles between in Vivo and in Vitro Produced Mouse Embryos during Postimplantation Period. J. Proteome Res. 12 (9), 3843–3856 (2013).
 Assisted reproductive technology (ART) increasingly is associated with long-term side-effects on postnatal development and behaviors. High-throughput gene expression analysis has been extensively used to explore mechanisms responsible for these disorders. Our study, for the first time, provides a comparative proteomic analysis between embryos after in vivo fertilization and development (IVO, control) and in vitro fertilization and culture (IVP). By comparing the dynamic proteome during the postimplantation period, we identified 300 and 262 differentially expressed proteins (DEPs) between IVO and IVP embryos at embryonic day 7.5 (E7.5) and E10.5, respectively. Bioinformatic analysis showed many DEPs functionally associated with post-transcriptional, translational, and post-translational regulation, and these observations were consistent with correlation analysis between mRNA and protein abundance. In addition to altered gene expression due to IVP procedures, our findings suggest that aberrant processes at these various levels also contributed to proteomic alterations.
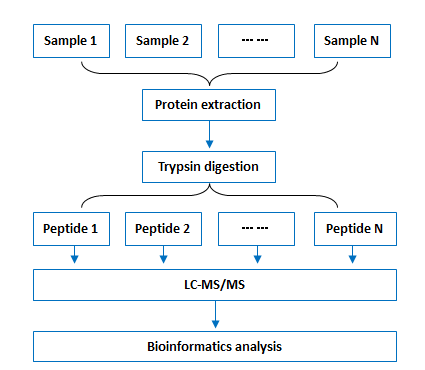
Workflow:
Bioinformatics:
Standard Bioinformatics Analysis
- Data statistics
- Protein identification by searching against database using MASCOT
- Protein quantification
Advanced Bioinformatics Analysis
- Protein GO category analysis
- Protein COG category analysis
- Protein pathway analysis
- Differentially expressed proteins (DEPs) GO enrichment analysis
- DEPs pathway enrichment analysis
- Repeatability analysis
- Expression pattern cluster analysis (no less than three samples)
Custom Bioinformatics Analysis
Sample Requirements:
|
Sample Type |
Amount of Sample required |
Comment(s) |
|
Fresh animal tissue (wet weight) |
≥ 100 mg |
For tissue with high impurity or low amount of proteins such as plant root or phloem, 5g sample is needed. |
|
Fresh plant tissue or fungus (wet weight) |
≥ 1 g |
|
|
Microorganism (e.g. bacteria) |
≥ 200 mg |
|
|
Cell |
≥ 3-5×10⁶ cells |
For phosphorylated protein identification, the cell number should be more than 107. |
|
Blood |
Serum / plasma ≥ 500 µl Whole blood ≥ 5 ml |
We do not recommend sending whole blood sample because blood cells can be broken during transport process. |
|
Please remove high-abundance protein before sending extracted proteins and attach gel images before and after the removal of high-abundance protein. |
||
|
Body fluid (e.g. saliva and cerebrospinal fluid) |
≥ 5 ml |
/ |
|
Urine |
≥ 50 ml |
Centrifuge at 1000g for 5min to discard the precipitate before sending your sample to BGI Tech. |
|
Protein extract |
≥ 500 µg (concentration ≥1mg/ml) |
/ |